Showing posts with label Diagrams. Show all posts

Monday, 9 June 2014

Word Clouds

Just a bit of fun, but also quite nice to see an overall idea of what I write about on this blog. Generated by Wordle:


So it seems I'm seriously interested in engineering, privacy (privacy engineering too!), data, technologies, analytics and so on.

Wednesday, 30 October 2013

Diagrams Research

For a number of years I and some colleagues have worked closely with the University of Brighton's Visual Modelling Group using their work on diagrammatic methods of modelling and reasoning. One of the areas where we've had quite a nice success is in modelling aspects of information privacy [1] with some particularly useful and beautiful and natural representations of complex ideas and concepts.

Another area has been in the development of ontologies and classification systems - something quite critical in the area of information management and privacy. Some of this dates back to work we made with the M3 project and the whole idea of SmartSpaces incorporating the best of the Semantic Web, Big Data etc.


We've gained quite a considerable amount of value out of this relatively, simple industrial-academic partnership. A small amount of funding, no major dictatorial project plans but just letting the project and work develop naturally, or even if you like, in an agile manner, produces some excellent, useful and mutually beneficial results.

Indeed not having a project plan but just a clearly defined set of things that we need addresses and solved (or just tackled - many minds with differing points of view really does help!) means that both partners: the industrial and the academic, can get on with the work rather than battling an artificial project plan which becomes increasingly irrelevant and industrial focus and academic ideas change over time. Work continues with more ontology engineering in the OntoED project.

References:
  1. I. Oliver, J. Howse, G. Stapleton. Protecting Privacy: Towards a Visual Framework for Handling End-User Data. IEEE Symposium on Visual Languages and Human-Centric Computing, San Jose, USA, IEEE, September, to appear, 2013.
  2. I. Oliver, J. Howse, G. Stapleton, E. Nuutila, S. Torma. Visualising and Specifying Ontologies using Diagrammatic Logics. In proceedings of 5th Australasian Ontologies Workshop, Melboune, Australia, CRPIT vol. 112, December, pages 37-47, 2009. Awarded Best Paper
  3. J. Howse, S. Schuman, G. Stapleton, I. Oliver. Diagrammatic Formal Specification of a Configuration Control Platform. 2009 Refinement Workshop, pages 87-104, ENTCS, November, 2009.
  4. I. Oliver, J. Howse, G. Stapleton, E. Nuutila, S. Torma. A Proposed Diagrammatic Logic for Ontology Specification and Visualization. 8th International Semantic Web Conference (Posters and Demos), October, 2009.
  5. J. Howse, G. Stapleton, I. Oliver. Visual Reasoning about Ontologies.International Semantic Web Conference, China, November, CEUR volume 658, pages 5-8, 2010.
  6. P. Chapman, G. Stapleton, J. Howse, I. Oliver. Deriving Sound Inference Rules for Concept Diagrams. IEEE Symposium on Visual Languages and Human-Centric Computing, Pittsburgh, USA, IEEE, September, pages 87-94, 2011.
  7. G. Stapleton, J. Howse, P. Chapman, I. Oliver, A. Delaney. What can Concept Diagrams Say? Accepted for 7th International Conference on the Theory and Application of Diagrams 2012, Springer, pages 291-293, 2012.
  8. G. Stapleton, J. Howse, P. Chapman, A. Delaney, J. Burton, I. Oliver.Formalizing Concept Diagrams. 19th International Conference on Distributed Multimedia Systems, International Workshop on Visual Languages and Computing, Knowledge Systems Institute, to appear 2013.

Tuesday, 4 June 2013

Data Collection

Anyone who cares about privacy will tell you that data collection is bad...REALLY BAD, yet without data collection none of the services we use and need would work (there's an economic argument there). Indeed most of the issues around data collection seems to be very emotive in nature and usually end up in the "data collection is bad/must be minimsed panic".

First to understand data collection we must understand from where data is collected. First of all we need to understand the relationship between a client and a server via some infrastructure. This is described in an earlier article which talks about primary and secondary data.

Generally the case we mainly worry about in privacy is where the client is a human interacting with an app or browser via some device, eg: a mobile phone.

The end-user (customer or human) will provide some information required to fulfill the functions of the service required, eg: posting a photograph to Flickr with some description and their login details.

So far this seems reasonable - afterall, a user is posting a photograph to their account with a description. The service might then perform an number of other tasks
  • Set the current time and date of upload
  • Extract EXIF information from the photograph, including (but not limited to):
    • date and time of the shot
    • location information
    • camera information
    • free text strings, eg: copyright/ownership information
All of the above comes under the notion of data collection and all of the above is information provided by the user of the service. One can argue that the user didn't know about the EXIF contents of the photograph and surprisingly few people actually realise how much information is embedded into the picture.

Further operations can be performed such as facial recognition and linking this to persons who have been tagged in other photographs etc. For example, this is a service provided by Facebook.

Additionally the service maybe collecting secondary information about the usage of the service, for example, how much time was spent using a particular page, what the UI/UX flow was and so on.

Then there's the information collected from the infrastructure. This includes information provided by the browser or app, typically in the form of browser identification strings, application identifiers, device identifiers, and from the service infrastructure including such information as source IP address, contents of the API call, time and date of interaction, error codes etc.

When we talk about privacy we typically end up focussing on the primary and secondary information sets. The former set to decide whether that information is necessary for the service to function and provide the facilities the user requires and the second set to decide whether this information needs to be explicitly collected or not. Rarely do we even investigate the information collected by the infrastructure which can be used both to recreate primary and secondary data sets. Indeed one of the major targets for any hacker are the infrastructure logs themselves.

When we talk about data collection we must consider the following data sets:

Primary, secondary and infrastructure are described as above with the addition that we split primary into explicit and implicit where the former denotes that information which is explicitly understood by the end-user and implicit including that information that might be hidden, eg: EXIF. Combined together we produce the Total Information Set which when linked together by simple association becomes the Total Deduced Information Set.

Another way of looking at this is in a more Venn diagrammatic manner:

Where the labels are abbreviations of the corresponding labels in the first diagram and colours for emphasis.

It must be noted that some intersections might not properly exist, for example the union of EP and Sec, and others only in certain contexts, for example, whether IP is a proper superset of EP or not.

Now we have explicitly modelled data collection, we can now start tackling questions such as what does minimisation of data collection actually mean and then start looking at what the processing and extraction functions over that data might actually look like.

Thursday, 9 May 2013

Foundations of Applied Mathematics

Via the n-Category Cafe blog I noticed a real gem in the workshop on The Foundations of Applied Mathematics. Simplifying systems and trying to understand the foundations of things (information systems, software engineering, privacy) is of great interest to me.

For example, in my current area of information system privacy we have a huge problem in even contemplating what the foundation of the discipline looks like, let alone trying to formalise it (and it probably has a lot to do with entropy, semantics, measurement theory and information flow if you ask me - but before we get there we've a lot of other work to do).

The particular piece of work that interested me was by John Baez who has a history of work trying to unify various areas of mathematics ostensibly through category theory and his presentation entitled The Foundations of Applied Mathematics (slides) presents his work on applying these ideas to applied mathematics. This was also followed up by an interesting discussion on Google+.

The whole presentation and body of work starts to remind me of a few things
  • layered architecture
  • esoteric  models of understanding (- need a better way of explaining this!)
  • visualisation (= diagrams)
Baez presents a model of four (for oversimplicity's sake as he describes in his presentation) layers linking science and engineering with applied mathematics with pure mathematics and finally grounding that in the foundations of mathematics. Immediately coming to mind here are the kinds of layered architecture we see in software engineering with each layer building upon the primitives provided by the immediate lower layer.  This is then followed by the question:

"Can developments in applied mathematics force changes in the foundations of mathematics?"
I'd have to answer 'yes' to this if only to assert the position that if the lower layers have not been correctly formulated or established and can not support the upper layers in their needs then the above is inevitable.

The reasoning for this comes from, at least in my chosen area of software engineering, is that layers [of software] are often constructed without any reference to any other layers, the operations and structures in those layers are not "atomic" or fundamental in nature with respect to that layer and the separation of concerns and layering of architecture is often a matter personal choice. Layers are often polluted with convenience functions and particular architectural choices, see Anti Patterns.

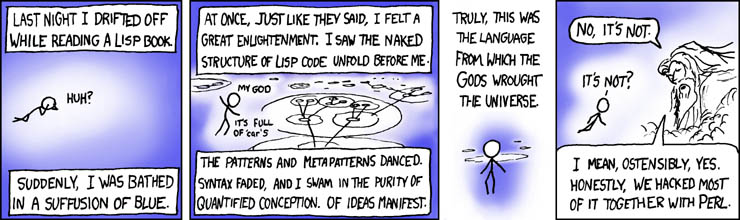
Another way of looking at this is via a famous xkcd cartoon on the relationship between Lisp, Diety and how it was really built:


Maybe it just is that the foundations aren't bad at all, just that we got the layering wrong. Maybe mathematics isn't layered at all...object oriented anyone?

Further in the Google+ discussion started by Baez, a posting by Carsten Führmann quoted Von Neumann:

"As a mathematical discipline travels far from its empirical source, or still more, if it is a second and third generation only indirectly inspired from ideas coming from 'reality', it is beset with very grave dangers...."

The quotation continues but the gist is that the further a discipline goes away from its foundations the more esoteric it becomes. I think in software engineering we see this quite clearly with things like use case modelling and agile methods. Not that there's much wrong with either but their current application is often far from the ideals proposed by their creators.These then get use to develop the architectural layers seen earlier.

In information system privacy we do not have a clear, coherent understanding of the foundations of the discipline and yet we are developing at very high levels of abstraction concepts, laws, ideas without understanding how these are to be architected into the technologies we are building. Contemplate the semantic gap between the European Privacy Directive and the actual C++ (or whatever) code that implements those. I'm not saying that laws, directives etc are wrong, just that even simple ideas such a Do Not Track will expose huge holes in our understanding of the discipline of privacy (and a lot of related subjects too). Actually I think that DNT won't work in its current form because too fee people do not want to address the formalisation of privacy but remain at some esoteric level far removed from what DNT is trying to address and that might have other implications and Von Neumannesque danger signals.

I won't discuss visualisation here, that's for another time, but just to reference the work at the University of Brighton on diagrammatic notation and also to refer to another point in Baez's presentation on the use of diagrams across disciplines (and layers of science) to express concepts to different audiences...presenting Euler diagrams to lawyers, marking people etc is an extremely interesting experience, especially when - as "non-mathematicians" - they start interacting using those notations and at some level we've "accidentally" unified the languages mathematicians and lawyers....

Monday, 16 April 2012

LoD 2012: Layout of Diagrams 2012

LOD 2012

3rd International Workshop on Layout of Diagrams 

Diagrams are an effective means of conveying a wide variety of different sources of information. They play a vital role in communication at many levels, and the quality of diagram layout effects the ease of communication. Creating task-adequate layouts is surprisingly difficult, and the cognitive factors involved are often not very well understood. The automatic generation of diagrams is essential for many tasks such as the presentation of multiple views of large scale data sets. In many domains, tool support is not satisfactory. The workshop aims to bring together different communities that can learn from each other, both within different academic disciplines and between academia and industry.
We solicit original submissions related to diagram layout, in areas including, but not limited to, the following areas:
  • Layout algorithms ;
  • Layout design styles, guidelines and patterns;
  • Automatic diagram generation and transformation techniques;
  • Visual language theory (e.g. quality metric development) ;
  • Visualisation of constraints, algorithms, and tools;
  • Cognitive or empirical research on diagram layout;
  • Diagram layout for diagrammatic reasoning, knowledge representation, etc;
  • Application areas (e.g. system modelling, ontology visualisation, etc, with an emphasis on layout requirements and benefits).
All diagram types fall within the scope of the workshop series (e.g. graphs, hypergraphs, Euler diagrams, maps, knot diagrams, etc). Of particular interest is research and techniques that may encourage interaction and knowledge transfer between fields. However, for this instalment of the workshop series, we particularly encourage submissions that have a software engineering orientation (e.g. those within UML, IDEF or ARIS), building on the success of two previous workshops at VL/HCC on the Layout of Software Engineering Diagrams (LED).

The proceedings of this workshop will be published in the journal of Electronic Communications of the EASST (TBC). All papers must conform to the ECEASST format. All papers must be submitted electronically in the PDF format via the EasyChair submission system. Each submission will be reviewed by 3 reviewers, as usual.

The intention is that after the workshop the authors of the best papers will be invited to submit a revised and significantly extended version of their article to a special issue of a sutiable journal (e.g. Journal of Visual Languages and Computing or the journal of Software and Systems Modeling).

Important Dates

  • Abstract Submission: June 11th, 2012
  • Paper Submission: June 18th, 2012
  • Notification to Authors: August 8th, 2012
  • Camera Ready Submission: August 30th, 2012
  • Workshop Dates: Oct 4th, 2012


Friday, 13 January 2012

Conferences

Always good to start a year off with a few conferences to be actively involved in:

And for each a short summary of their content:


Diagrams 2012:
Diagrams is the only conference series that provides a united forum for all areas that are concerned with the study of diagrams, including architecture, art, artificial intelligence, cartography, cognitive science, computer science, education, graphic design, history of science, human-computer interaction, linguistics, logic, mathematics, philosophy, psychology, and software modelling. The conference attracts a large number of researchers from virtually all these related fields, positioning Diagrams as a major international event in the area.
VL/HCC 2012:
From the beginning of the computer age, people have sought easier ways to learn, express, and understand computational ideas. Whether this meant moving from punch cards to textual languages, or command lines to graphical UIs, the quest to make computation easier to express, manipulate, and understand by a broader group of people is an ongoing challenge.
VLC 2012:
Visual languages mediate human and computer interaction. For some visual languages this mediation is straightforward; using a mouse to access a drop-down menu is well-known to computer users. For others, this mediation can be enriched via sketch and gesture recognition. This is made possible by advances in commodity hardware. More formal visual languages allow experts to accurately specify complex systems, such as software architecture or chemical molecules. A visual language can also encompass complex human-computer interaction such as navigating a set of semantically linked videos. Indeed, precision of semantics underlies visual languages and computation. 
UbiCOMM 2012:
The rapid advances in ubiquitous technologies make fruition of more than 35 years of research in distributed computing systems, and more than two decades of mobile computing. The ubiquity vision is becoming a reality. Hardware and software components evolved to deliver functionality under failure-prone environments with limited resources. The advent of web services and the progress on wearable devices, ambient components, user-generated content, mobile communications, and new business models generated new applications and services. The conference makes a bridge between issues with software and hardware challenges through mobile communications.    


    Tuesday, 10 January 2012

    Diagrams

    First post of the new year and hopefully things will continue in this manner: I've been elected to the steering committee of The Theory and Applications of Diagrams* conference series.

    The International Conference on the Theory and Application of Diagrams

    Diagrams is a biannual, international and interdisciplinary conference series, covering all aspects of research on the theory and application of diagrams.

    Recent technological advances have enabled the large-scale adoption of diagrams in a diverse range of areas. Increasingly sophisticated visual representations are emerging and, to enable effective communication, insight is required into how diagrams are used and when they are appropriate for use. The pervasive, everyday use of diagrams for communicating information and ideas serves to illustrate the importance of providing a sound understanding of the role that diagrams can, and do, play. Research in the field of diagrams aims to improve our understanding of the role of diagrams, sketches and other visualisations in communication, computation, cognition, creative thought, and problem solving. These concerns have triggered a surge of interest in the study of diagrams.

    The study of diagrammatic communication as a whole must be pursued as an interdisciplinary endeavour. Diagrams attracts a large number of researchers from virtually all related fields, placing the conference as a major international event in the area.

    The next conference - Diagrams 2012 - will be in July in Canterbury, UK:

    7th International Conference on the Theory and Application of Diagrams.
    Canterbury, UK, 2-6 July 2012
    Diagrams is an international interdisciplinary conference series, covering all aspects of research on the theory and application of diagrams. In 2012 it will be held at the University of Kent overlooking the history city of Canterbury in the UK.

    Diagrams is the only conference series that provides a united forum for all areas that are concerned with the study of diagrams, including architecture, art, artificial intelligence, cartography, cognitive science, computer science, education, graphic design, history of science, human-computer interaction, linguistics, logic, mathematics, philosophy, psychology, and software modelling. The conference attracts a large number of researchers from virtually all these related fields, positioning Diagrams as a major international event in the area.
    *these sorts of diagrams: ontological diagrams (and coffee) and also (beautiful) specifications...